2016 Census Rollout - Municipal
Implications
Colin Macdonald
March 3,
2017
The 2016 Census - Population and Dwelling Count Data
Throughout 2017,
Statistics Canada will be releasing data from the 2016 Census Program. On February 8,
2017,
the population and dwelling count data was released. For more details on the 2016 Census Program release
schedule see the Statscan
release page.
The rollout of the Census data can impact
municipalities in multiple ways;
the demographic trends observed can alter our plans for future spending. The data from the census is
often a primary source of information for decision-makers at both the provincial and federal orders of
government and can have significant impacts on program funding allocations. For example,
the Federal Gas Tax is allocated to Province based on populations,
which is then allocated to municipalities based on similar criteria;
according to Infrastructure
Canadathe Gas Tax Fund will begin using 2016 Census data for its 2019 allocations.
The Picture
Province-wide
According to the 2016 Census Provincial
Highlight Tables,
Canada's population grew at a rate of approximately 5%
since 2011. Relatively,
Ontario is slightly behind growing at 4.6%. Ontario's
population still makes up 38.26% of Canada's population, compared to 38.39% in
2011.
99.32% of Ontario's population lives
within Ontario's municipalities, with the remainder living in unincorporated
territories;
this figure is down .02% from 2011.
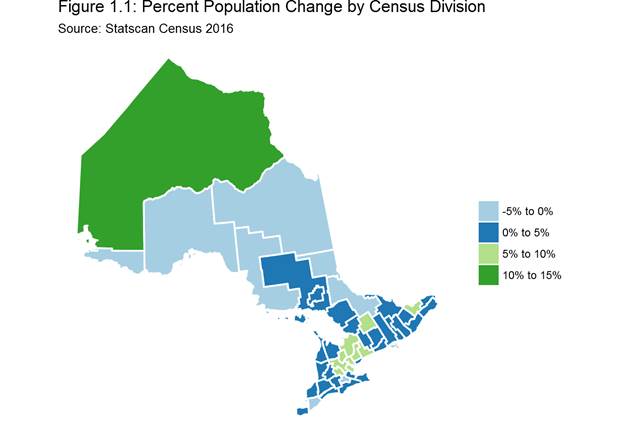
Figure 1.1 shows percentage change by
Census division. Unlike the following tables and graphs,
this data also includes unincorporated territories. While much of southern and eastern Ontario are
showing growth in the 0 to 5% range,
the areas around the City of Toronto are growing in the 5 - 10% range,
while the City itself is in the 0 to 5 % growth range along with much of the rest of Southern Eastern
and South Western Ontario,
with a few exceptions for higher growth and a couple of districts (Chatham-Kent, Brant, and Prince
Edward County) showing some population decline.
Much of North Eastern Ontario is showing
slight decline with the notable exception around the Sudbury region. It should be noted that while the
population in these areas are largely declining,
we will show evidence later that approximately half of the municipalities are stable or showing
growth.
North Western Ontario is showing a mix of
rapid growth in the Kenora census division and slight decline in the Rainy River and Thunder Bay
districts.
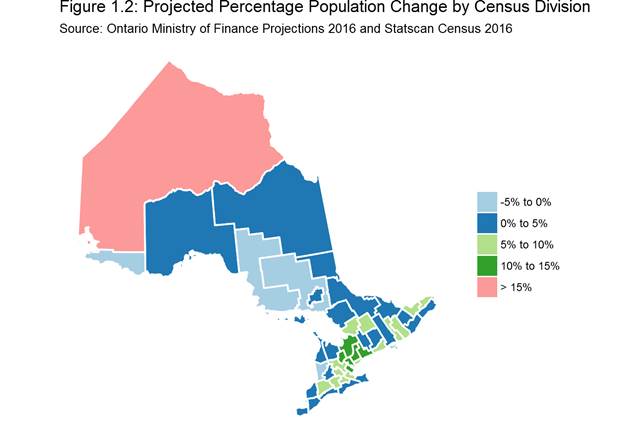
Figure 1.2 shows the expected changes in
Ontario based on the Ontario Ministry of Finance's population
projectionsfor 2016. You will note that growth in many of the census divisions is slightly less
than expected,
particularly in the areas around Toronto and the North East.
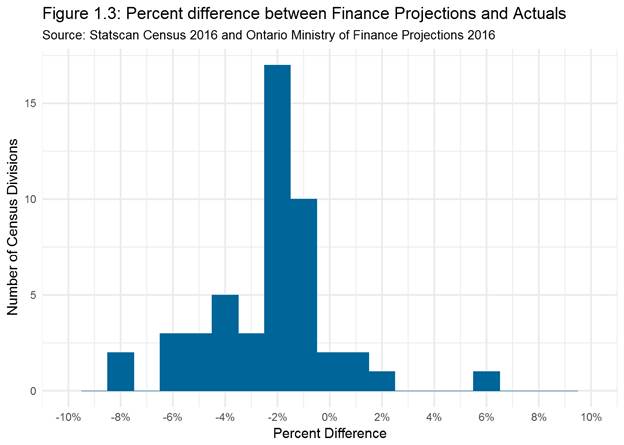
Figure 1.3 shows a histogram of the
percentage difference between projected population and the 2016 census populations. Most census
divisions have a lower population than projected in the Spring of 2016,
with two census divisions coming in at approximately 8% lower than projected.
The Municipal
Picture
Overall municipalities in Ontario are
growing. The median population in Ontario municipalities rose from 6,
808 in 2011 to 7,
081 in 2016,
meaning 50% of municipalities in Ontario have a population of at least 7,
081. Meanwhile the average population rose from 45,
895 to 48,
114 in 2016,
but as we will see a large part of that can be attributed to growth in the large urbans. In terms of
percentage of population change,
the average was 2.074% and the median was 2.032%. The biggest positive population shift was 39% while
the largest decline was 44.99%. See table 1.1,
below,
for more details.
Table 1.1: Summary Statistics
on Municipal Population Data
|
|
Population 2016
|
Population 2011
|
Percent Population
Change
|
|
|
Min. : 0
|
Min. : 0
|
Min. :-44.988
|
|
|
1st Qu.: 1747
|
1st Qu.: 1808
|
1st Qu.: -1.182
|
|
|
Median : 7081
|
Median : 6808
|
Median : 2.032
|
|
|
Mean : 48144
|
Mean : 45895
|
Mean : 2.074
|
|
|
3rd Qu.: 20457
|
3rd Qu.: 18653
|
3rd Qu.: 5.107
|
|
|
Max. :2731571
|
Max. :2615060
|
Max. : 39.001
|
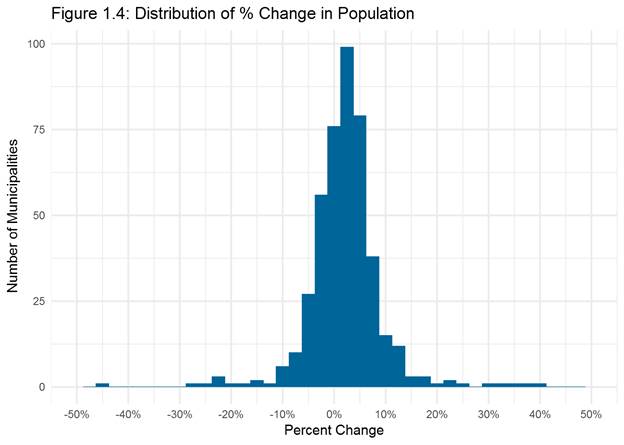
Figure 1.4 below shows that bulk of
municipalities are relatively stable in terms of population change. As noted in table 1.1,
the mean change in population is 2.074%,
and most fall within the -5% to 5% range and municipalities growing or declining at a rate of more than
10% are few.
Municipalities by MSO Region
When looking at municipalities in the
MSO regions we'll not that the largest growth region was the Central region
with 6.7% average growth and a median change of+4.78%. Municipalities in the North Western region saw
the most decline with an average of -2.82% and a median change of -2.12%. See Table 1.2 to see the
aggregate changes for municipalities in your region.
Table 1.2: Percentage Change in Population in Ontario Municipalities (by MSO
Region)
|
MSO Region
|
Number of Municipalities
|
Average % Change
|
Median % Change
|
Min % Change
|
Max % Change
|
|
Central
|
78
|
6.70
|
4.78
|
-8.89
|
39.00
|
|
Eastern
|
114
|
1.59
|
1.50
|
-9.35
|
9.77
|
|
North Eastern
|
110
|
0.41
|
-0.01
|
-44.99
|
34.85
|
|
North Western
|
34
|
-2.82
|
-2.12
|
-22.30
|
12.15
|
|
Western
|
108
|
2.48
|
2.16
|
-7.95
|
37.43
|
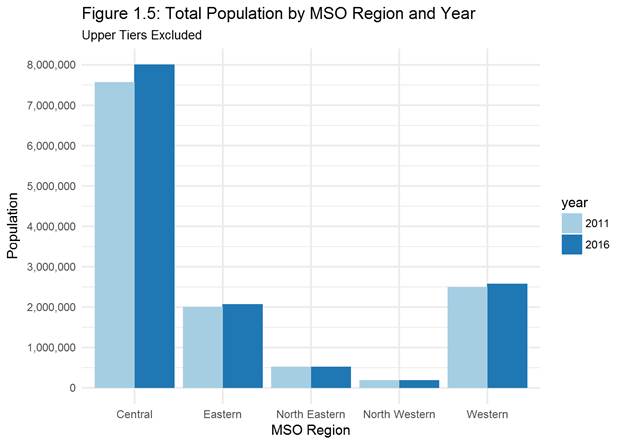
As shown in figure 1.5,
above,
the bulk of Ontario's population lives in the Central region. Municipalities in that
region are also showing the most overall growth compared to 2011.
Municipalities by Population Group
When comparing municipalities it can
be useful to group those that fall within a similar range of a particular attribute to note differences
within the spectrum. In this instance we have divided Ontario's municipalities into 10 subgroups based
on their population
range.
Table 1.3,
shows that,
for the most part,
smaller municipalities are getting smaller and large urbans are getting bigger. Municipalities that fall
in the 20 to 50K,
200 to 500K,
and the great than 500K ranges are experiencing the most growth,
each with an average of above 5%.
Table 1.3: Percent Change in Population in Ontario Municipalities (by Population
Group)
|
Population Group
|
Number of Municipalities
|
Average % Change
|
Median % Change
|
Min % Change
|
Max % Change
|
|
<
1K
|
80
|
-0.36
|
-0.25
|
-44.99
|
37.43
|
|
1 - 2.5K
|
51
|
-0.40
|
-0.44
|
-14.14
|
11.81
|
|
2.5 - 5K
|
61
|
0.62
|
-0.11
|
-12.06
|
15.63
|
|
5 - 10K
|
75
|
2.35
|
1.59
|
-6.03
|
39.00
|
|
10 - 20K
|
65
|
3.32
|
3.08
|
-5.35
|
13.71
|
|
20 - 50K
|
42
|
5.55
|
3.76
|
-3.19
|
25.81
|
|
50 - 100K
|
26
|
3.40
|
3.36
|
-3.91
|
11.84
|
|
100 - 200K
|
24
|
4.24
|
2.48
|
-1.95
|
30.54
|
|
200K - 500K
|
10
|
5.41
|
5.52
|
2.62
|
9.03
|
|
>
500K
|
10
|
6.30
|
5.98
|
1.14
|
13.31
|
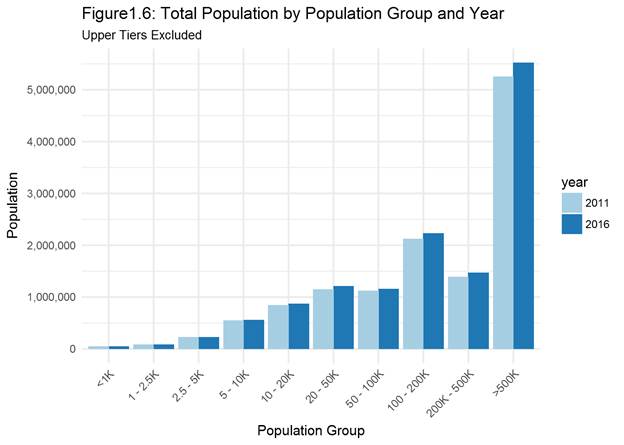
Figure 1.6 shows how many people live in
municipalities of different sizes. When compared to table 1.3's ' Number of Municipalities' counts it is
clear that while there are substantively more
smaller municipalities their collective population pales in comparison to the larger urban
municipalities.
Conclusions
Some of the observations yielded
through cursory analysis are:
•
Ontario is growing but at a slower rate
than the rest of Canada.
•
Most of Ontario's population lives within
municipal boundaries;
however,
population growth in unincorporated territories slightly outpaced that of municipalities,
relatively speaking.
•
Ontario's population change is lower than
projections for most census divisions.
•
Most of Ontario's municipalities
experienced
slight decline or slight growth (-5% to +5%),
but there were a few outliers with over 10% decline or growth on either side of the spectrum.
•
On aggregate,
municipalities in the Central MSO region are growing at a faster pace,
while municipalities in the North West MSO region are showing some decline.
•
On aggregate,
smaller municipalities are getting smaller or are stagnant and the larger urban municipalities are
showing more rapid growth.
Municipalities should note changes in
their census data,
particularly their position relative to other municipalities in Ontario. They will impact your
municipality's ability to generate own source
revenue in the future,
and they should impact your plans for future infrastructure spending.
Census data will also factor into
formula-based funding,
as is case with the aforementioned Federal Gas Tax. Population,
households,
and median household income,
in particular,
often factor into formula-based funding allocations,
such as the Ontario Communities Infrastructure Fund (OCIF) and several programs under the Ontario
Municipal Partnership Fund (OMPF).
Data Sources
•
A financial information return (FIR)
compatible datafile with 2016 Census data for all 444 Ontario municipalities is now available in MFOA's
Virtual Library
in CSV format. The datafile is compatible with FIR data in that it shares a common municipal ID code
attribute (MUNID). It can be found under 'Data Files.'
•
The maps were created using 2016 census
boundary files,
which can be found on the Statistics
Canada website.
•
Municipal Service Office (MSO) regions
were determined using the Ministry of Municipal Affairs Financial Information Return dataset for the
year 2009 - the Current Year,
available in CSV and RDA formats on the FIR website.
•
The Ontario Ministry of Finance population
projections uses the 2016 projections for census divisions from their annual population projections,
from 2016 to 2041. The data can be found in XLSX format in the Province of Ontario's data catalogue.